Goals
Goals turn raw traffic into distinct insights – sign-ups, purchases, newsletter joins, whatever matters to you can be tracked.
Below is an overview of the features available after you have created one or more goals (setup is covered in the Getting Started guide).
Goals widget
Each site dashboard shows a Goals table summarising for the selected date range:
| Column | Description |
|---|---|
| Goal | Name you set on creation. |
| Conversions | Number of times it fired. |
| Conv. rate | Conversions ÷ visitors × 100. |
| Revenue | Sum of the value you optionally pass with each hit. |
Click any row to open the Goal drill-down page.
Drill-down details
The dedicated view helps answer deeper questions:
- Conversion timeline – interactive chart of conversions per hour/day; bucket size auto-adjusts to the range.
- Cards – total conversions, total revenue, average value.
- Top pages – which URLs led to the conversion (e.g. blog posts sending sign-ups).
- Top referrers – campaigns or websites driving goal completions.
Everything respects the date range selector (7 days, 30 days, custom) so trend analysis is one click.
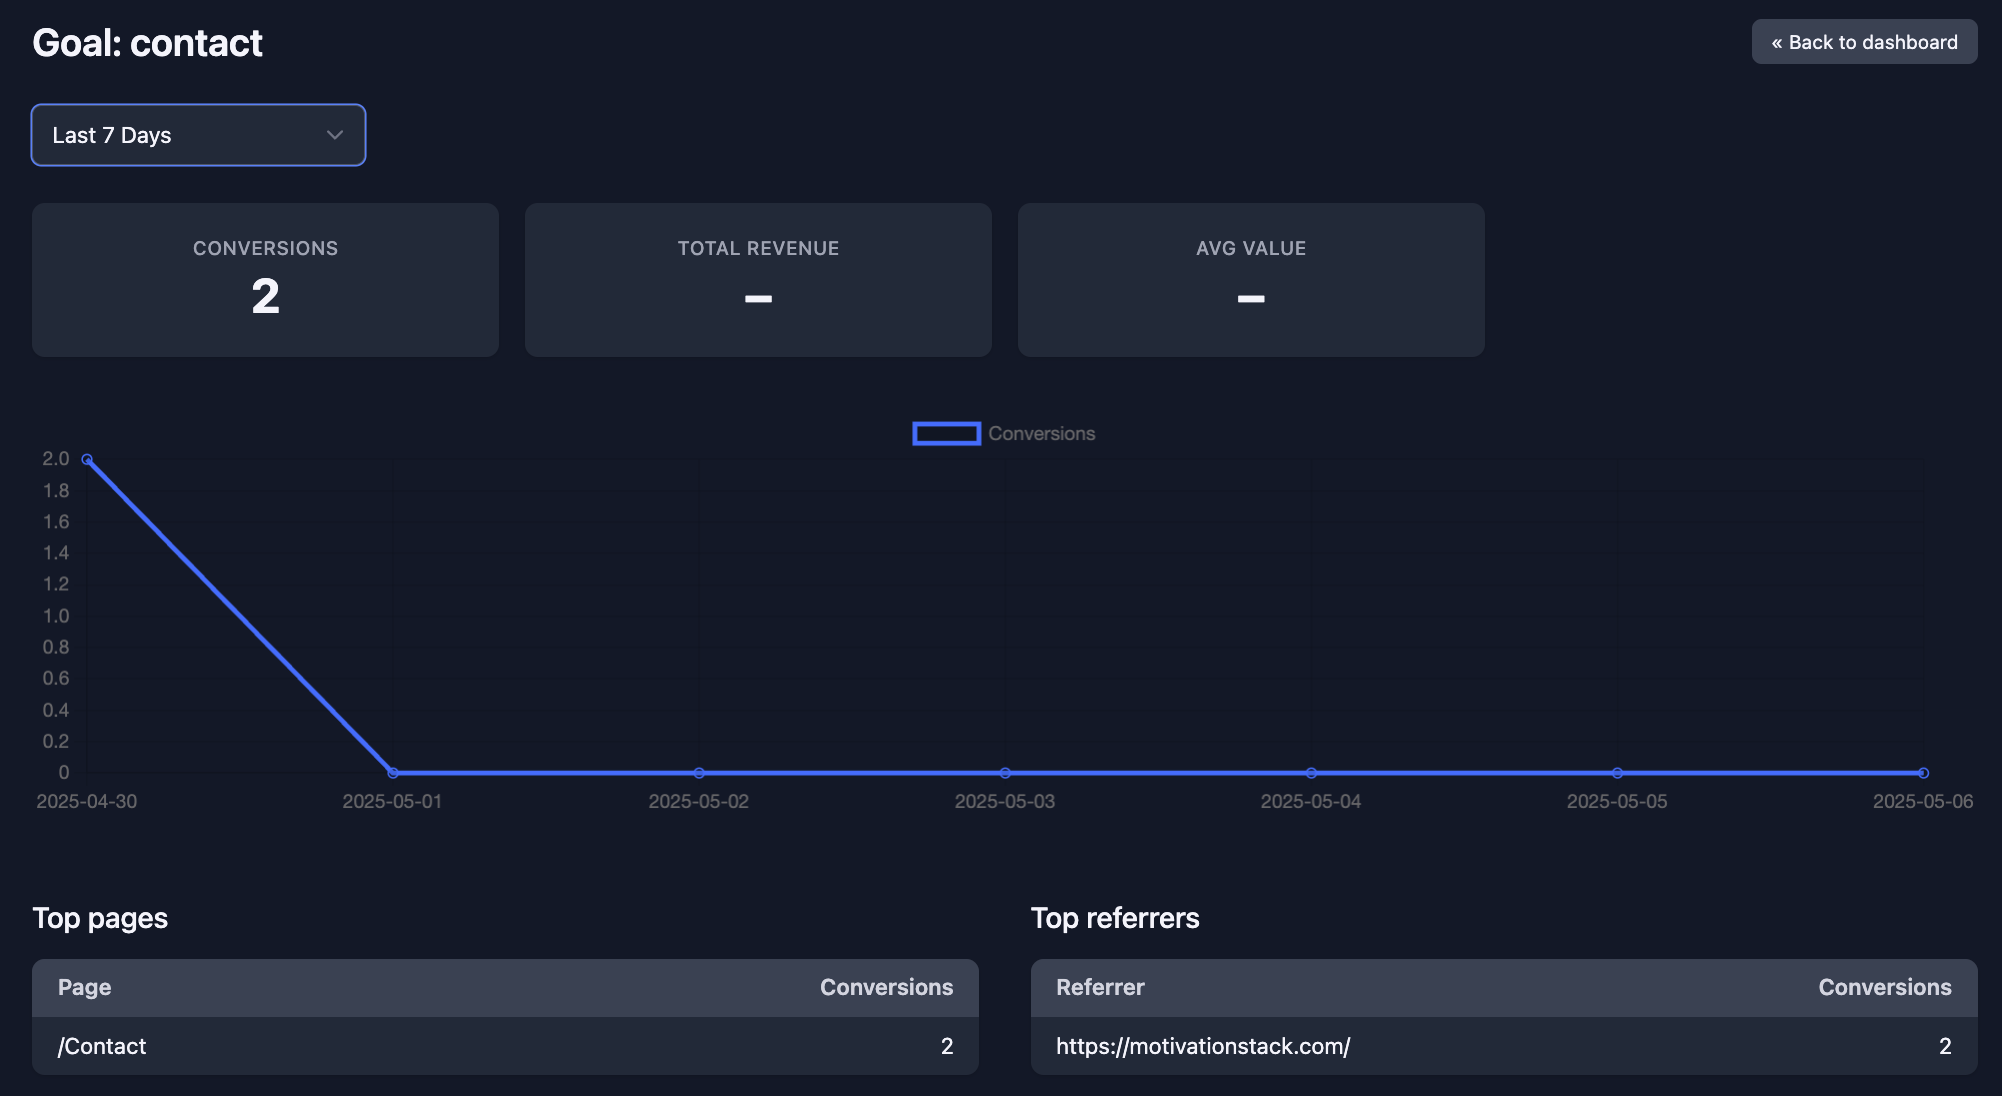 Goal drill-down page
Real-time tracking methods
Goals can fire in three ways:
- Manual / JS – call
analytics.goal('signup')from your own JavaScript; pass{ value: 19.99 }to record revenue. - Click attribute – add
data-analytics-goal="checkout"to a link or button – no code needed. - URL match – automatic when the page path matches a rule you define (e.g.
/thank-you).
Goals triggered by any of these methods appear in the widget within seconds – handy during launch days.
Exporting goal data
Goal hits are included in the CSV export with their value, so you can slice further in spreadsheets if needed.