Site dashboard view
Open any single website from All Sites view to see its real-time dashboard. Everything you need fits on one page; widgets update automatically every few seconds.
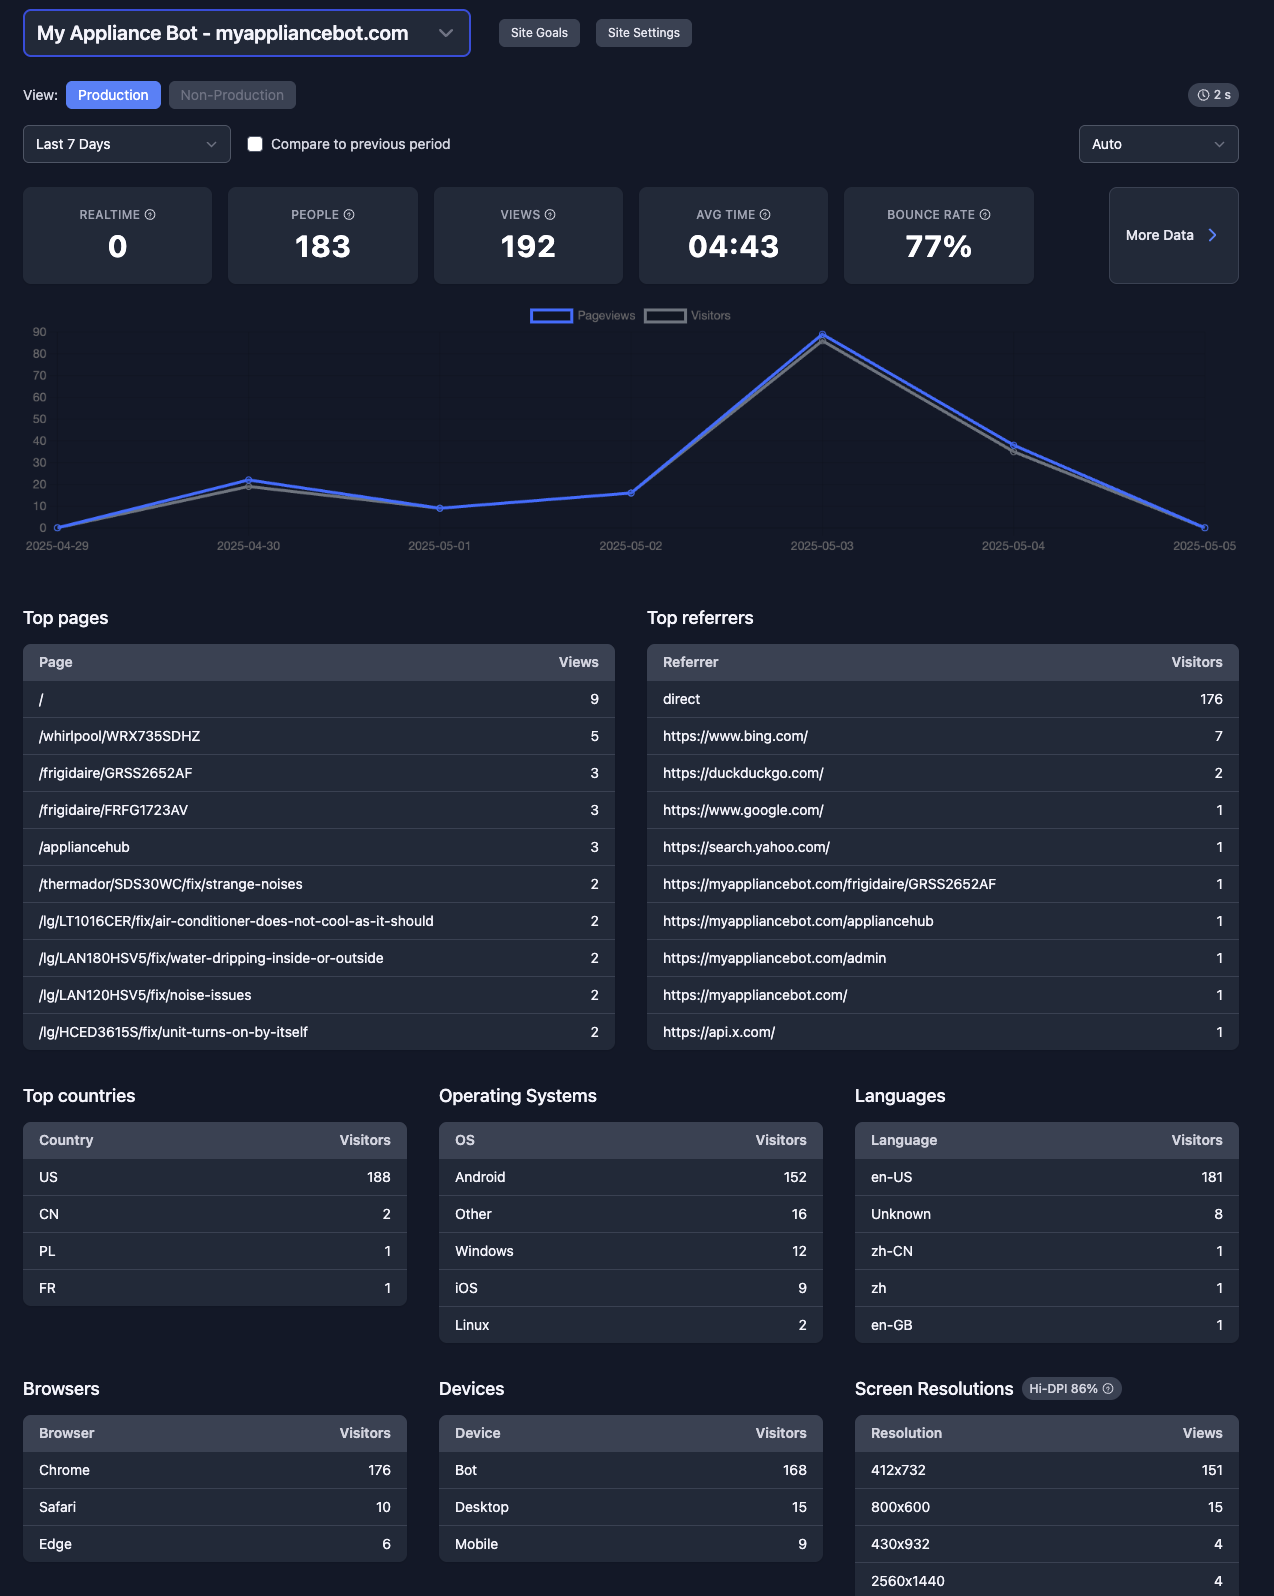 Full dashboard with date selector
Header controls
- Site selector – switch between sites or "All Sites" aggregate. “Add site” lives at the bottom of the list.
- Prod / Non-production toggle – view traffic from dev/staging domains separately if you marked them as non-prod in settings.
- Data delay badge – shows current ingestion lag (edge → database). Hover for tooltip.
Date & bucket selector
Top of page: choose a preset (Today, Last 7 Days …) or range. Enable Compare to previous period for delta arrows. Bucket size can be forced to hourly or daily – otherwise we pick automatically.
Metric cards
The first row presents at-a-glance totals for the chosen range:
- Realtime – live visitors on the site (updated via ping events).
- Page-views (PV) – total page-views.
- Visitors – unique visitors (cookie or cookieless session).
- Bounce rate – % leaving without a 2nd hit within 30 s.
- Avg. time on page – measured with visibility/ping events.
- Conversions – if you created goals.
Traffic graph
Interactive bar/line showing PV and Visitors over time buckets. Hover for exact numbers; comparison mode overlays the previous period in grey.
Tables
- Top pages – paths + PV + Visitors. 404s are highlighted.
- Referrers – direct / search / social / custom + any UTM campaigns.
- Countries – by ISO code.
- Devices, Browsers – desktop/mobile/tablet and user-agent breakdown.
Click any row to run an instant drill-down filtered to that page, referrer or country. The side panel shows its own traffic graph and live visitors.
Goals & revenue
When you have goals the Goals widget lists conversions, conversion rate and revenue (if you assigned a value). Click to open detailed goal view.